Scientific Lead: Jack Wee LIM, Ph.D.
Email: lim_jack_wee@a-star.edu.sg
Head of Platforms: Shanshan HOWLAND, Ph.D.
Email: shanshan_howland@a-star.edu.sg
Manager: Kim Peng TAN
Email: tan_kim_peng@a-star.edu.sg
General Enquiries: SIgN_IMP@a-star.edu.sg
RSC Website: CyTOF on RSC
Unlock Deeper Immune Insights with Mass Cytometry at SIgN
The Mass Cytometry (CyTOF) Platform at SIgN is the first Centre-of-Excellence in Asia to provide access to the latest suspension and spatial technology using metal-conjugated antibodies. We offer next-generation solutions for high-dimensional immune profiling with unparalleled resolution.
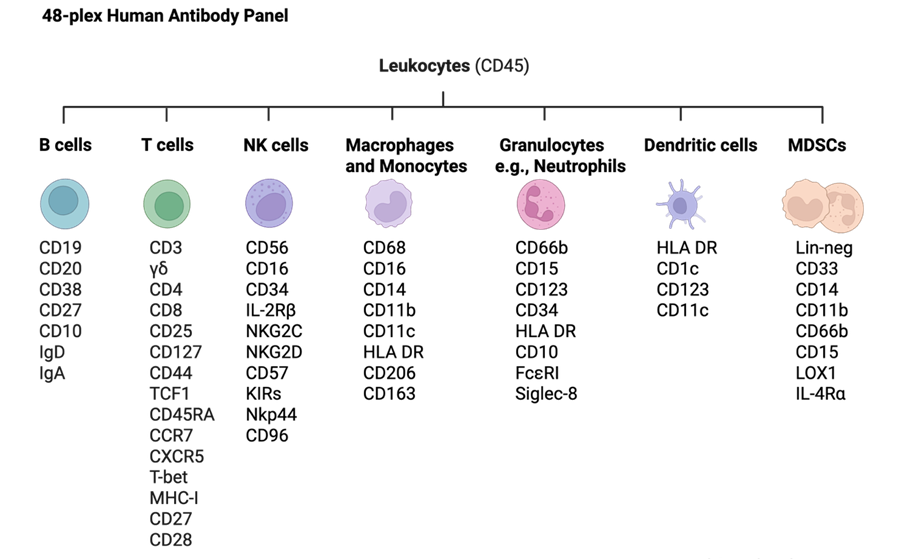
At SIgN, we enable precise detection of 45-plus markers simultaneously on millions of cells using antibodies tagged with rare heavy metal isotopes, virtually eliminating spectral overlap while detecting more and novel immune cell types.
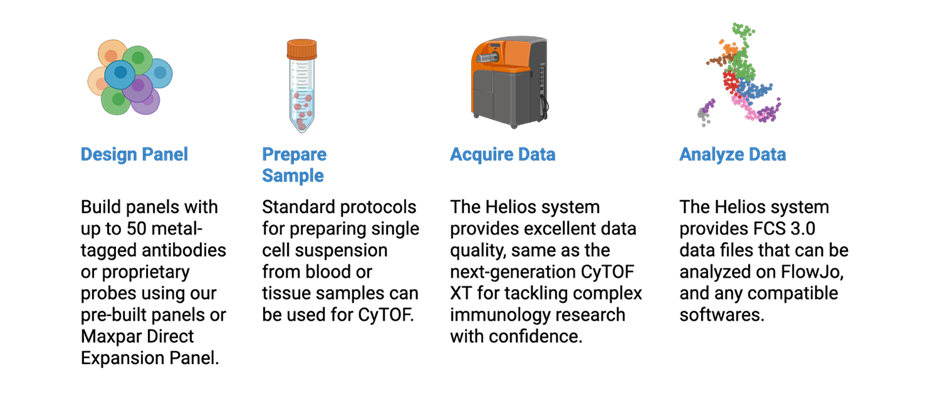
Researchers have access to cutting-edge platforms using the Helios Suspension Mass Cytometer and the Imaging Mass Cytometry service, supporting both high-dimensional suspension cell profiling and spatial tissue imaging. These systems power:
- Comprehensive immunophenotyping
- Deep immune cell subset analysis
- Discovery of antigen-specific CD8 T-cells
- Longitudinal immune monitoring
- High-resolution tissue imaging
- Advantage: Distinct signal without overlap; reduce multiple flow panels into one large panel
We also provide comprehensive service in the following areas for both blood and tissues:
- Assay support and design for many commercially available antibodies as well as proprietary probes#
- Custom antibody conjugation and verification
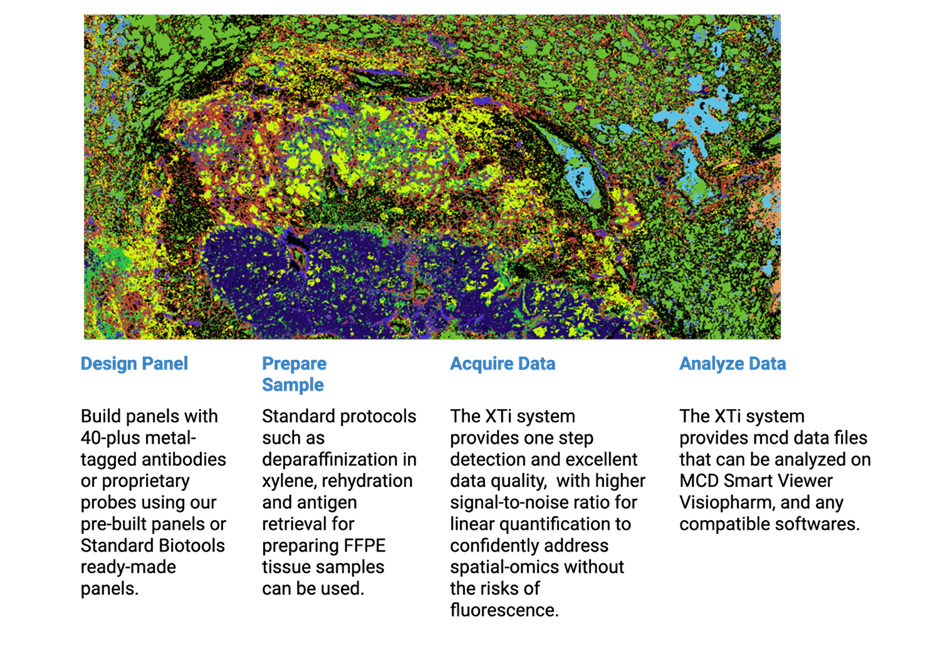
- Tissue antibody staining for Imaging Mass Cytometry*
- Includes markers for accurate cell segmentation in Imaging Mass Cytometry*
* We will arrange for the Imaging Mass Cytometry data to be collected at an oversea XTi facility.
# Our in-house recombinant protein system creates CyTOF-ready probes.
Whether you are studying cancer, autoimmunity, infectious or inflammatory disease, our mass cytometry platforms enable you to explore immune complexity at unprecedented depth for various sample types, including whole blood, PBMCs, tumour tissues and CAR-T cell products.
The 48-plex human antibody panel for CyTOF provides an immune portrait that can be modified to allow other immune markers to be easily included. Use as is or modify to build a custom panel.
Imaging Mass Cytometry Workflow
Imaging Mass Cytometry panel kits are available HERE.
For more details, contact SIgN_IMP@a-star.edu.sg.
Feel free to reach out to us if you have any enquiries about customizing your panel.
Selected Publications
- Tay R.E., et al. (2025) Serotonin receptor 5-HT2A as a potential target for HCC immunotherapy. J Immunother Cancer, 13(6): e011088. doi: 10.1136/jitc-2024-011088
- Lee, W.W.L., et al. (2024). Counterproductive effects of anti-CD38 and checkpoint inhibitor for the treatment of NK/T cell lymphoma. Frontiers in Immunology, 15, 2024. doi: 10.3389/fimmu.2024.1346178
- Lee, W.W.L, et al. (2023). Eosinophilic allergic rhinitis is strongly associated with the CD45RBlo subset of CD161+ Th2 cells that secretes IL-2, IL-3, IL-4, IL-5, IL-9, and IL-13. Allergy, 2023, August 7. doi: 10.1111/all.15846
- Lim, J., et al. (2021). Data-driven analysis of COVID-19 reveals persistent immune abnormalities in convalescent severe individuals. Frontiers in Immunology, 12, 710217. doi: 10.3389/fimmu.2021.710217
- Chan, Y.H., et al. (2021). Asymptomatic COVID-19: disease tolerance with efficient anti-viral immunity against SARS-CoV-2. EMBO Molecular Medicine, 13(6), e14045. doi: 10.15252/emmm.202114045
- Lim, J. (2020). Destabilizing single chain major histocompatibility complex class I protein for repurposed enterokinase proteolysis. Scientific Reports, 10(1), 14897. doi: 10.1038/s41598-020-71785-2
- Newell, E.W. et al. (2009) Simultaneous detection of many T-cell specificities using combinatorial tetramer staining. Nature Methods, 6(7): 497-499. doi: 10.1038/nmeth.1344